How to Build an Investor-Ready GTM Narrative Before a Series B or C Raise
- Roger M.

- 2 days ago
- 6 min read
Your Series B pitch deck has a GTM slide. It shows a funnel graphic, a few channel logos, and the word “scalable.” The investor looks at it for 11 seconds, then asks: “Walk me through your unit economics by channel and tell me what happens to pipeline coverage at 2x the current spend.”
You do not have a good answer. Because the slide was built to look credible, not to withstand interrogation. The funnel graphic implies a system. The channel logos imply diversification. The word “scalable” implies a thesis. But none of it is backed by the data that a Series B investor needs to underwrite a $30M to $100M pre-money valuation.
This is the GTM narrative gap. Most founders can articulate why their product is valuable. Far fewer can articulate why their go-to-market engine is investable — meaning capital-efficient, repeatable, measurable, and independent of any single person. The GTM narrative is not a marketing exercise. It is a financial credibility exercise that determines whether the round closes at the valuation you need. And the gap between a compelling GTM narrative backed by data and a vague one backed by aspiration is typically the gap between a term sheet at 12x ARR and one at 7x — or no term sheet at all.
What is a GTM narrative for investors?
A GTM narrative is the structured argument that explains how your company converts market opportunity into revenue — and why that conversion engine deserves investment at the valuation you are requesting.
It is not a description of your marketing channels. It is not a funnel diagram. It is an investment thesis about your commercial engine, structured around four questions every Series B investor asks:
1. Is the ICP validated? Can you prove, with closed-won data, that you know exactly which companies buy your product, why they buy it, and how much they pay?
2. Is the acquisition engine efficient? Can you show CAC payback under 12 months, by channel, with trend data demonstrating compression or stability?
3. Is the motion repeatable? Can the GTM operate without the founder on every deal? Is there a documented playbook that new hires can execute within 90 days?
4. Is the revenue durable? Does NRR exceed 110 percent? Is expansion programmatic? Is logo retention above 90 percent with structural stickiness?
A GTM narrative that answers all four questions with data — not assertions — is what separates a pitch that closes a round from one that generates “interesting, let’s stay in touch.”
How do you present your go-to-market to Series B investors?
The GTM section of a Series B pitch should contain three to four slides, each addressing a specific investor concern with data rather than narrative.
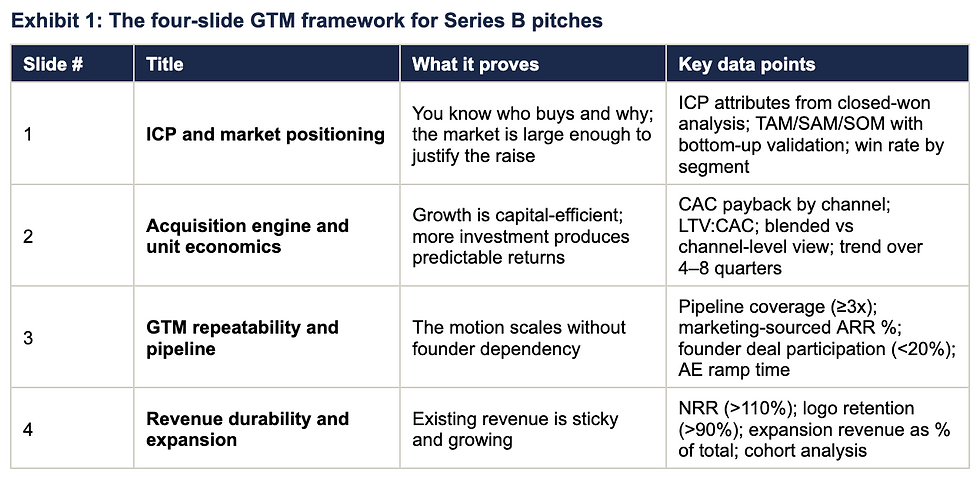
Slide 1: ICP and market positioning. This slide replaces the generic TAM bubble chart that every pitch deck includes. Instead of top-down market sizing (“The global SaaS market is $300B”), it presents a bottom-up ICP analysis derived from closed-won data: here are the 2,400 companies in our addressable market that match the attributes of our best customers, at an average ACV of $36K, representing a $86M serviceable obtainable market. Win rates against this ICP are 28 percent, versus 9 percent outside the ICP. This is a thesis the investor can verify — not a hope they must believe.
Slide 2: Acquisition engine and unit economics. Show CAC payback by channel with four to eight quarters of trend data. The investor needs to see two things: that the current engine is efficient (payback under 12 months on the primary channels), and that efficiency is stable or improving as spend scales. If Google paid search has 7-month payback at $30K/month spend, what happens at $60K? If LinkedIn is at 16 months, is it improving or degrading? This slide must include fully-loaded CAC (all marketing and sales costs) — not the marketing-only calculation that founders sometimes present to make the numbers look better. Investors will recalculate with full loading during diligence. Present it honestly upfront.
Slide 3: GTM repeatability and pipeline. This is the slide that answers the question every investor is thinking: what happens if the founder steps back from sales? Show pipeline coverage at 3x or above, marketing-sourced ARR as a percentage of total new logo revenue (target 40 percent+), founder deal participation trending downward (below 20 percent), and AE ramp time (how fast new hires reach quota). Companies with strong GTM alignment grow 19 percent faster and 15 percent more profitably (Bain). This slide proves the alignment exists.
Slide 4: Revenue durability and expansion. NRR above 110 percent is the single strongest predictor of premium valuation multiples in SaaS. This slide shows NRR with cohort analysis (are newer cohorts performing better?), logo retention above 90 percent, and expansion revenue as a growing percentage of total. The investor reads this slide as the answer to: “will the revenue I’m underwriting still be here in three years, and will it grow without proportional acquisition spend?” The best versions of this slide include a retention waterfall showing how each annual cohort has expanded over time, and a clear breakdown of expansion sources: upsell, cross-sell, usage-based growth, and price increases. This granularity signals that expansion is systematic, not accidental.
What does a VC want to see in a GTM slide?
Beyond the four-slide framework, VCs evaluate the GTM narrative against five credibility tests. Failing any one reduces confidence; failing two or more typically kills the deal.

Internal consistency is the test that catches most founders off guard. The GTM slide says CAC is $12,000. The financial model assumes $8,000 CAC in year two to hit the growth projections. The investor sees the gap instantly — the growth plan requires efficiency improvements that the GTM narrative does not explain. Every number on the GTM slides must reconcile with the financial model. A fractional CMO who has built GTM narratives for multiple raises knows exactly where these inconsistencies hide and eliminates them before the pitch.
Founder honesty is the test that builds or destroys trust. Investors understand that founders drive deals in early-stage companies. They do not penalise this. What they penalise is pretending the team is already independent when it is not. Showing founder deal participation at 55 percent with a documented plan to reach 20 percent by month 12 is far more credible than claiming the team is already self-sufficient when the data says otherwise. Honesty about the current state, combined with a credible plan for the target state, is what closes rounds.
Measurement maturity is increasingly a gating criterion at Series B. Partners Capital reports that global VC fundraising hit its lowest since 2017 and capital concentration around top funds reached a decade high. In this environment, investors have more options and less tolerance for companies that cannot prove their commercial claims. A company that says “we think marketing contributes about 30 percent” gives the investor no basis for underwriting the growth plan. A company that says “38 percent of new logo ARR was marketing-sourced in Q3, up from 29 percent in Q1, measured through multi-touch attribution in HubSpot” gives the investor a data point they can verify, a trend they can extrapolate, and confidence they can underwrite.
The narrative is not the slides. It is the system behind the slides.
A GTM narrative that closes a Series B round is not built in the two weeks before the pitch. It is built over months of systematic GTM construction: ICP validated from closed-won data, attribution infrastructure producing clean channel-level data, sales motion documented and executed by the team, and revenue metrics trending in the right direction with trend data visible.
The slides are the output. The system is the input. A fractional CMO who has prepared multiple companies for Series B and C raises builds the system and the narrative simultaneously — ensuring that every slide in the pitch deck is backed by data the investor can verify during diligence, and every metric in the model is grounded in a GTM reality that the team can actually execute.
The timeline matters. Building the GTM system that produces investor-grade data takes three to four months. Accumulating the trend data that makes the narrative compelling takes another three to six months. Companies that begin GTM preparation six to nine months before a raise have the trend data that closes rounds. Companies that begin 30 days before have slides with numbers but no trends — and trends are what investors underwrite.
McKinsey’s Global Private Markets Report 2026 shows why this investment pays for itself. Revenue growth accounted for 71 percent of exit value creation in 2024 PE exits. The companies that can prove their revenue engine is systematic, measurable, and transferable command premium multiples. Those that present aspirational narratives without evidentiary backing compete on price in a market where over 16,000 companies are already waiting for their exit.
The founders who close rounds at the valuations they need are not the ones with the best pitch decks. They are the ones whose GTM narrative is indistinguishable from their operating reality — because the narrative was built from the data, not the data retro-fitted to the narrative. A fractional CMO makes that alignment possible within the timeline and budget constraints of a Series B company.
→ Download the GTM narrative framework: rogemabag.com/contact-us
The complete four-slide framework with data requirements, sample layouts, and the five credibility tests. Use it to build your pitch deck’s GTM section before your next raise.
Sources: McKinsey & Company, Global Private Markets Report 2026; Partners Capital, Insights 2026; Bain & Company Commercial Excellence Benchmark; SaaS GTM benchmarks 2025–26.


Comments